

Monitor and Color Management:
With many imaging devices ![]() being additive systems of red, green and blue colors, signal encoding based on the RGB primaries is a rather natural choice. Since RGB color space is device-dependent,
being additive systems of red, green and blue colors, signal encoding based on the RGB primaries is a rather natural choice. Since RGB color space is device-dependent,![]() the color appearance of any digital image can shift when the image is moved from one device to another. In practice this means that pictures that we see on our display could be seen differently on our friend's display and may not print such saturated greens or faithful skin tones in the photo lab across the street. Color management ensures controlled conversion between the color representations of various devices using color transformations via a device-independent color space. Such device-independent space, also called profile connection space (PCS) serves as a broker between different devices. One can think of it as if the digital information coming from an image displayed on monitor is translated into common language in the PCS and then translated again into another language that printer understands well.
the color appearance of any digital image can shift when the image is moved from one device to another. In practice this means that pictures that we see on our display could be seen differently on our friend's display and may not print such saturated greens or faithful skin tones in the photo lab across the street. Color management ensures controlled conversion between the color representations of various devices using color transformations via a device-independent color space. Such device-independent space, also called profile connection space (PCS) serves as a broker between different devices. One can think of it as if the digital information coming from an image displayed on monitor is translated into common language in the PCS and then translated again into another language that printer understands well.
It follows rather naturally that in order to produce digital images or prints that meet our expectations in regard to color and consistency, one has to adopt certain standards to devices (display, scanner, printer, camera) involved in the color managed workflow.
First, there is the PCS - a device-independent encoding standard such as CIEXYZ or CIELAB. PCS is an internal part of device profiles defined and standardized by International Color Consortium (ICC). Device profiles are usually available from manufacturers and can be freely downloaded from their web site. Second, color-imaging devices involved in our workflow have to be properly calibrated and profiled. And finally, we need a system to process all the color conversions. Such systems are known as color conversion engines (CCM) and are usually part of the computer operating system or part of the specific software like Adobe Photoshop.
As outlined above (and now specifically for the display part) when editing an image file, display has to render the image colors in the color space of that display. Color management system (CMS) is then responsible for correct translation of colors within the image profile and the Photoshop working color space that uses the monitor profile. The CMS uses input and output profiles to convert device-dependent image data into and out of a central, device-independent profile connection space (PCS). Device characterization data is stored in profiles such that an input profile provides a mapping between input RGB data and the PCS, and an output profile provides a mapping between the PCS and output RGB values (Sharma 2002).
Let's stay focused on the display. To get the best tonal and color fidelity from the display output, monitor calibration preferably followed by monitor profiling should be performed. Monitor calibration is the first and the most critical step in the color management process. Importance of the display calibration should not be taken lightly as the monitor is the only component of our digital system that lets us see and edit digital images before sending them to printer or the Web. The calibration part is not that difficult to perform, although some extra money ($100-200) is needed if one wants to set the white point and brightness to certain specific values. For a simple visual calibration of display gamma and brightness, plenty of free tools are available. In this section, I will discuss specifically LCD panels, although the profiles created do not distinguish between LCD and CRT displays or computer operating systems. Calibration part may vary a bit from CRT to LCD.
Before going to the specifics, let me bring to your attention the following excellent books on color management:
- B. Fraser, C. Murphy, and F. Bunting: Real World Color Management
- A. Rodney: Color Management for Photographers
- A. Sharma: Understanding Color Management
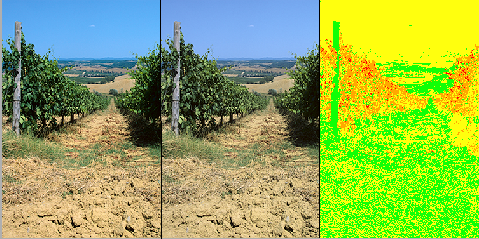
Following panel illustrates specific examples of images rendered by applications that are either color managed through the icc profiles or that lack the color management features. For settings that enable full color management in Mozilla Firefox browser, see my blog post.
| Figure 1: Appearance of images in sRGB and Adobe RGB color spaces |
|---|
 |
(top)↑Monitor Calibration and Profiling:
As we have discussed in the previous section, the effective use of LCD or CRT displays in digital photography assumes a proper calibration. Only then the color displayed at a given pixel can be reliably predicted for each possible digital input. Display calibration involves all the electronic and software components related to the visual output, i.e., video driver, video card, and the actual monitor. When calibrating a display, three parameters are typically adjusted to a desired state:
As explained in the section on the LCD displays, the only parameter that can be controlled at the hardware level is the brightness. Sometimes the luminance of monitor black can be adjusted as well, although it usually stays at the minimum level (LCD ~ 0.2-0.4 cd/m2, Fig. 2). For LCD monitors, white and black luminance is interconnected, so as we increase the white luminance, the black levels are increased too. Ratio of the maximum luminance output (white) and the minimum luminance output (black) is the so called "contrast ratio". Our goal is to set the brightness to a value where we feel comfortable working for several hours. This value will depend on the surrounding luminance and parameters of our display. For typical LCD display luminance is set in a range of 120-140 cd/m2. As a note, during the brightness adjustment, shape of the TRC curve is not changed.
The color correlated temperature (CCT) defines our white point. White point is the result of mixing the red, green, and blue channels near their maximum output. Setting channels to their maximum outputs corresponds to the so called "native" white point. Gain values of the RGB outputs (around their maximum luminance outputs) will define the "color" of our white point (warmer yellowish, cooler bluish).
| Figure 2: Calibration target points |
|---|
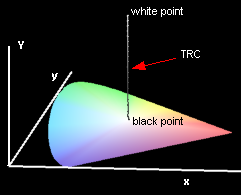 |
Figure 2 shows the white point set as the target value during a typical calibration. Spatial coordinates of the white point are usually expressed in terms of xy-values in the (xy)-chromaticity diagram. The color temperature adjustment will generally change the brightness as well as the shape of the TRC curve. Tone response curve (TRC, gamma) entered as the calibration target will describe nonlinear luminance response to linearly changing values of R'G'B' digital input. Tonal curve(s) go from the black point to the white point (for grayscale) or to the maximum luminance of the each RGB channel. It is yet another goal of the calibration to set the colorimetric values upon which the device color space can be built. At this point, coordinates of the white point (expressed as CCT in calibration software) and the tone response curve(s) are defined (Fig. 2).
Monitor calibration: the process that involves adjustment of brightness, white point, and gamma. Calibration establishes a known starting condition and reproducible means of returning the display to that state. Colorimeter or spectrophotometer are needed to ensure unbiased adjustments of the key parameters. In the process of calibration, software will display color patches of known reference values, these values will be read by the measuring instrument and the software will then use results of this measurement to adjust video card LUT to get as close as possible to our target parameters (brightness, white point, gamma). As an example, the following values could have been read from the OSD panel of a calibrated monitor: brightness 43%, R-gain 94, G-gain 96, and B-gain 100. These values may physically translate into, e.g., luminance of 120 cd/m2 and the white point of 6,500 K. Thus at any time we change values in the OSD menu to the above values, our display would be in the standard state of about 120 cd/m2 with the white point of 6,500 K. The value of gamma is typically entered as a calibration parameter and it refers to the tonal response of the neutral gray (R=G=B). During the calibration, the factory response of the display or adjustments entered into the internal display LUT are determined. Then, based on the selected gamma, the white point, and the brightness, a correction is calculated, stored in the calibration file, and loaded into the video card LUT by the operating system or by a proprietary "lutloader" upon the startup. The final calibration file usually contains an array of 256 rows. Included are input RGB values and the corresponding "corrected" R'G'B' values. For example, for input value of 1, the output values could be R=887, G=953, and B=1,032 (for 16-bit encoding). Since the number of levels available through the OSD menu is usually low (e.g. 2 levels per step), higher precision is achieved in the video card LUT with assistance of the software controlled instrument. Precise calibration thus always requires optical instrument to achieve the requested standard state.
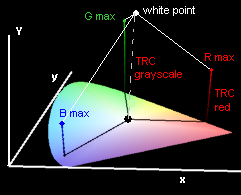
| Figure 3: Profiling (matrix profile) |
|---|
 |
| Figure 4: Profiling (LUT profile) |
|---|
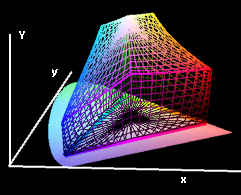 |
We now continue from calibration to profiling. To completely describe the given calibrated state, even more information has to be gathered. At minimum, three additional "anchor" points have to be obtained, specifically the coordinates of the RGB primaries (Fig. 3). That is why any calibration software will display red, green, and blue patches at their highest luminance output. At the same time, the tone response curves for each channel are either measured or calculated from the three RGB ramps or from the series of grayscale patches. For simple matrix-based profiles, XYZ or L*a*b* values of the white point and RGB primaries are stored in the icc profile. XYZ values of each primary color then form columns of the [3 x 3] transfer matrix which is necessary to calculate the device-independent XYZ values for any R'G'B' input. Together with the RGB primaries, tone response curve information is the essential part of the icc profile. Purpose of the TRC (gamma) curves is to calculate the linear RGB values from the gamma-corrected R'G'B' digital input values. Only then the transfer matrix can transform RGB values to device independent XYZ values. On the other hand, the LUT-based profiles use a 3-D lookup table to correlate the source and destination color values by interpolation within the grid of points. Any color within the device gamut can then be predicted with a high accuracy. Figure 4 may serve as an example of how the color is predicted at any given point at the boundary of the device gamut. In practice, the 3-D CLUT table is typically a cube with n3 lattice points (typical n = 17, 31, 33).
As discussed in the previous paragraph, icc profiles can be either matrix-based or look-up table-based (LUT). Following are some typical types of display profiles obtained after display calibration and profiling:
- Single gamma & matrix - one gamma value for all three channels together with the transfer matrix (size ~ 1Kb)
- R,G,B gamma & matrix - gamma values for each channel are available together with the transfer matrix (size ~ 1 Kb)
- R,G,B shaper curves & matrix - three 1-D lookup tables (OTCF), one for each channel together with the transfer matrix (size ~ 3 Kb)
- LUT-based - use input and output curves as 1-D lookup tables for each channel and one 3-D lookup table (CLUT), all of these as one set for each rendering intent. LUT profiles use CIELAB as profile connection space (size ~ 400 Kb - 1,500 KB)
CRT displays and high quality LCD displays can use the smaller shaper/matrix profiles. For other LCD displays, use of LUT-based profiles is recommended.
In contrast to CRT monitors, most of the LCD adjustments (white point, gamma, TRC) are done in the video card LUT. As most common video cards use 8-bit LUTs and output 8-bit DVI signals, tweaking of the LUT will result in lose of some levels (out of the original 256). To convince yourself, check out the Bruce Lindbloom's Level calculator. Higher-end LCD displays, such as Eizo line of graphic monitors use 10-bit monitor LUTs to adjust color temperature and gamma. In this case, the calibrated system is still capable of producing the full 256 levels of gray.
Monitor Profiling: still relies and builds upon the above calibration steps. To make the profile available to different applications that can use it, the display calibration is stored in a device profile. Information about the calibrated and profiled state is thus passed to other device profile with assistance of the CMS. Calibration and profiling are usually sequential processes. The software displays more patches on the screen, analyzes measured data and then builds a display profile. Profiles used in the color management have their own structure that is standardized by the International Color Consortium (ICC). ICC profile files have extension .icc or .icm and are platform independent. Profiling is a passive process that does not change any hardware settings (only describes the hardware) and as such, even poorly profiled display can have a very accurate profile. This gets us back to the importance of proper calibration that conforms to common standards (white point, gamma).
Most of the display profiles contain a special section called a 'vcgt' tag. This tag stores the calibration data (that reflect the white point and gamma) in the form of lookup curves. During the calibration, the factory response of the display or adjustments entered into the internal display LUT are determined. Then, based on the selected gamma and the white point, a correction is calculated, stored in the 'vcgt' tag, and loaded into the video card LUT by the operating system upon startup.
If you wish to skip directly to examples, here is the link.
Practical points :
- Except of the brightness, all adjustments of common LCD displays are done by tweaking the LUT in video card. Higher end monitors use 10-bit LUT build-in the display.
- Editing 8-bit lookup tables is essentially the same as editing 8-bit per channel image in Photoshop (some of the original 256 levels will be lost).
- Unless the LCD monitor has internal 10-bit per channel LUT, set the white point and gamma to the "native" if such option exists in calibration software or use D65 (CCT 6,500 K) and gamma 2.2. These values are very close to the "native" settings built in the display electronics by most manufacturers.
- A ballpark numbers for luminance setting are around 120 cd/m2 (LCD) and 90 cd/m2 (CRT).
- Before calibration, always reset the video card LUT to ensure that LUT is in its original "cleared" state.
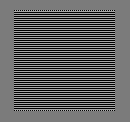
- After calibration, always check smoothness of the grayscale gradient. The test image should be neutral without any signs of color. Also, there should be no banding or posterization visible in the image.
(top)↑General tips for LCD monitor calibration:
This part will assume that we have a colorimeter available and a profiling software that works with it. In case that we do not have colorimeter, I'll recommend reading the following web page - Norman Koren: Monitor Calibration. References to other web sites that describe monitor calibration without using any measuring instrument are at the bottom of this page.
First, one would probably like to know what colorimeter and software package to buy. Well, I'll list some common options, but I'll leave it up to you to do some research on the Web.
- ColorEyes Display Pro from the Integrated Color Corp. One can buy just the software that supports multiple measuring instruments or the bundle that includes excellent colorimeters such as the DTP-94 from X-Rite (now merged with GretagMacbeth) or Spyder2 from DataColor.
- Eye-One Display 2 from GretagMacbeth which comes with Eye-One Match 3.6 software. This software supports only measuring devices from GretagMacbeth (Eye-One Display 1, Eye-One Pro Spectrophotometer)
- Spyder3 products from DataColor. Colorimeter and software come together in multiple bundles.
As we might have suspected, these packages are not free and one can expect to pay from $80 - $330 for both the colorimeter and the software. In case that we already have a colorimeter or just purchased one from, say, the e-Bay, there is very high chance that we might be able to use it with free software written by Graeme Gill. This suite of command line utilities is called Argyll CMS - an open source, ICC compatible color management system. If you are interested in exploring this option, click here.
One additional note on the LCD monitor calibration. Recent LCD monitors are capable of Direct Digital Communication (DDC) - this allows for the display’s brightness, contrast, white point, and gamma to be adjusted by the calibration/profiling software and the measuring device. There is no need to enter any values from the OSD panel. When shopping for a new monitor, choose the DDC2-compliant display if possible. When deciding between commercial profiling packages (those above), make sure that the chosen software recognizes and fully uses your DDC capable monitor.
Here is what I am currently using to calibrate and profile my LCD monitor: ColorEyes Display Pro or Argyll CMS with either DTP-94 colorimeter or EyeOne Pro spectrophotometer. I am happy with Argyll CMS utilities and I am just learning how to use ColorEyes Display Pro.
Calibration tips:
- Disable any competing calibration or profiling software that gets loaded during the computer startup. These would be listed in the Startup folder and may look similar to the ones on the snapshot below.
To avoid deleting these links permanently, I have created a new folder called "StartNot" in the Start > Programs folder. To do that, right-mouse click on the "Start" icon down left and choose "Explore". Then select "Programs" and create new directory "StartNot". Now, we are ready to move any offending calibration programs from the "Startup" to "StartNot". Go to Start > Programs > Start Up and drag those icons to "StartNot". Adobe Gamma is another example of utility that should be moved out from the "Startup" folder. Restart the computer to finalize these steps.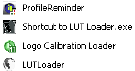
- Make sure that your display has been turned on for at least 30 min. Make sure that you disabled any "sleep mode" or "monitor off" options in Power settings. On Windows XP, right-mouse click on the desktop, choose "Properties" and then "Screen Saver" tab. From there, go to "Power" and set "Turn off Monitor" to "Never" or at least to several hours.
- Get yourself familiar with the on-screen buttons and On-Screen Display (OSD) menus. You are looking for something like gamma, brightness, gain, and reset.
- Set up the room in a way that you will be editing your photos after the calibration/profiling. Position of any light source is important and any direct light toward the monitor should be avoided. I work in a dimly lit room with a spot lamp far behind me pointing in the other direction.
- Reset the monitor from the OSD menu. This will load factory presets.
- Clear the video card LUT. I use the following free utility to clear the video card LUT table. Calibration LUT Tester from the former GretagMacbeth web site. There is no installation needed, just put the shortcut to your desktop, run it and click on "Reset". Appearance of your monitor may change - that is OK. We are ready to proceed with the calibration.
- If you are using any of the commercial or freeware softwares, follow their instructions. Here are few links to web tutorials for the commonly used products (please send me a link if you find other). ColorEyes Display Pro, EyeOne Display2 with Eye One Match, Spyder3Pro, calibration systems comparison.
- Now the calibration and probably also profiling have been done and the measured data is saved in icc profile. Make sure that the particular LUT loader is now present in the "Startup" folder to allow for reloading the measured data after computer restart. Following freeware utility (DisplayProfile) from the former GretagMacbeth web site comes handy when loading or switching between display icc profiles in the video card LUT (in case you also have a monitor LUT [higher end monitors], this utility will not update it).
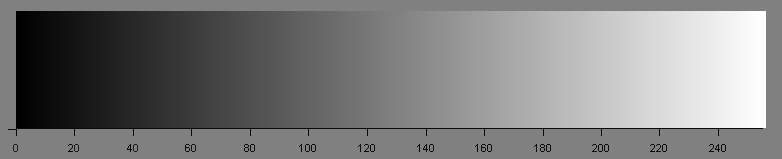
- Always verify your new calibration by visual inspection of a few test images. Just display these images either in the internet browser or in some default picture viewer. Since there is no color management involved at this stage (those applications are most probably not color managed), you do not have to worry about any icc profiles at this point. You are looking for even tonal gradation, proper monitor gamma and no color cast in gray areas. Following gray scale image is encoded with gamma of 1 and will be rendered differently on monitors with different gamma values.
(top)↑ Colorimetric Characterization:
The term characterization is sometimes used interchangeably with profiling. In context of this discussion, characterization refers to the analysis of current state of a device (calibrated or not) with the main purpose to establish descriptive parameters of the device. No profile is created or needed. On a more technical level, device characterization describes the degree of accuracy of mappings between the color spaces of individual devices and a device-independent color space (CIEXYZ, CIELAB). There are several parameters of interest that describe the mapping accuracy. Usually several mathematical models have to be tested to colorimetrically characterize any given device. Again, in our case of LCD monitors, characterization will describe the quality of calibrated or manually preset display state. Following are some examples of display states that can be characterized:
- Factory default preset (usually achieved by pressing RESET button on your monitor OSD)
- Factory preset for a given preset parameters (e.g., gamma 2.2, white point 6,500 K)
- Pre-calibrated state (white point and brightness were adjusted using the OSD panel, gamma is unknown)
- True calibrated state (includes the above and LUT adjustment by loading the LUT data or the 'vcgt' tag from icm/icc profile to match the desired white point, gamma, and brightness)
We would, of course, be very much interested in evaluating the calibrated state that we have just created. However, a few words of caution are in place: colorimetric characterization provides complex results which include characteristics of display electronics, video card, colorimetric measuring device (with the corresponding software drivers), and the software used for calibration. As such it is not easy to directly compare measuring devices or calibration/profiling packages. To that direction, multiple measurements using the same hardware should be performed varying only one parameter at the time (measuring device or software package). Also, just to repeat, the process of device characterization at this level has nothing to do with color management and ICC profiles. Later on we will be looking at profile characterization which will be done in color managed application and will combine both calibration and profiling measurements.
Let's take a more detailed look at the process of characterization. Conversion of RGB image pixel values to the CIEXYZ tri-stimulus values of the color displayed on the monitor is a two stage process.
First, one wants to calculate the relationship between input image pixel values and displayed luminous intensity. As we have learned, this relationship is the optoelectronic transfer function, often simplified as gamma. The transfer functions will usually differ for each channel and are best measured independently using three RGB ramps.
In the second stage, transformation between the displayed red, green and blue colors to the CIE tristimulus values is performed. This is most easily performed using a matrix transform of the following form: [XYZ]T = [3x3] x [RGB]T where X, Y,Z are the desired CIE tri-stimulus values, R, G, B are linearized R'G'B' values and the [3x3] matrix comes from the measured CIE tri-stimulus values for our display's three channels.
This process implies that two critical factors are involved in the process of any device characterization, namely the linearization and the transformation matrix.
Math behind the Display Characterization:
As discussed in the section of Calibration, part of the LCD display calibration is the mapping of input RGB values to corresponding values in some standardized color space, such as CIEXYZ. For the purpose of colorimetric characterization, luminance and R'G'B' digital counts (dc; values sent to a monitor) are normalized between 0 and 1. Furthermore, in order to treat the image information as a linear function of the luminance, we need to modify the R'G'B' dc domain (it has to be linearized). The modification applied is known as gamma correction or linearization and can be achieved by a variety of techniques. While CRT monitors usually use the GOG model, LCD monitors have no straightforward analytical functions for linearization. In this case, the best solution is to use experimentally created lookup tables (LUTs). These tables then use different forms of interpolation to find the best luminance output for a given set of dc inputs.
From the mathematical point of view, calibration involves two consecutive steps. The first step ensures that the output intensity varies linearly as a function of the input R',G',B' values. The second step defines a linear model for the RGB-to-XYZ mapping that is based on 3-by-3 linear transformation matrix C.
Typical calibration process involves sending samples of RGB inputs to the display and measuring the corresponding XYZs from the screen. Since the number of RGB-XYZ data points far exceeds the nine entries of C, the math problem is so called overdetermined. In other words, there are more equations than unknowns. In this case, the C is usually solved for by minimizing the sum of the squares of the residuals for the predicted and measured XYZ values. Specifically, the equation that we are solving is: [XYZ]T = C * [RGB]T It is shown in full in other section of these pages. Let's put [XYZ]T= y and [RGB]T = X. Then the sum of the least squares we minimize is following:
min||X*C - y||2 while the corresponding linear equation in the matrix form is: X * C = y
Now, if we multiply both sides by XT, we obtain: XT*X*C = XT * y
From there, after solving for C, one gets: C = (XT*X)-1 XT y This solution is known as the pseudoinverse and can be easily calculated in Excel spreadsheet. In Matlab, more robust and faster solution using the backslash operator is used to compute the least squares solution to such a system (C = X\y). Again, X is a matrix of linearized RGB values and y is the matrix of the measured XYZ values.
While these methods provide acceptable results, their inherent weakness is the quantity being minimized, that is, the Euclidean distance in XYZ which, unfortunately, is not the most appropriate quantity to minimize. The reason is that XYZ color space is not perceptually uniform. Small XYZ differences in certain areas can be quite noticeable for human observer. Obvious remedy would be to minimize for color differences in a perceptually uniform color space, such as CIELAB. One convenient method for general minimization problem is the Nelder-Mead simplex algorithm. Nelder-Mead algorithm is a direct search method for multi-dimensional nonlinear regression. In Matlab, the corresponding function is fminsearch. Advantage of using this algorithm is no need for continuity of the function or actually existence of any function at all. To ensure that global minimum was reached, several input values are usually used. As mentioned in the section on "Transformation of the RGB primaries", white point preservation during optimization of matrix C is important, especially for the gray scale rendering. Using the original optimization scheme of Berns, I have added white point correction together with random changes in both the transformation matrix C and the linearized R'G'B' values into a new algorithm that optimizes for minimal difference in ΔE2000 of measured and predicted Lab values.
(top)↑Links and References:
General references :
- H.R. Kang, Computational Color Technology, SPIE Press, Bellingham, Washington USA (2006)
- M.R. Pointer, G.G. Attridge, The number of discernible colors, Color Res. Appl. 23, pp. 52-54 (1998)
- B.A. Wandell, L.D. Silverstein, Digital color reproduction, The Science of Color, pp. 281-316 (2003)
- A. Sharma and P. D. Fleming: Evaluating the Quality of Commercial ICC Color Management Software, TAGA Technical Conference, North Carolina, April, 2002
- E.A. Day, L. Taplin, R.S. Berns, Colorimetric Characterization of a Computer-Controlled Liquid Crystal Display, Color Res. Appl. 29, pp. 365-373 (2004)
Monitor adjustment, calibrations and profiling :
- Monitor adjustment (Hans Irtel)
- Monitor Calibration Help
- Gernot Hoffmann (computer vision section - multiple pdf documents)
- Dry Creek Photo - Monitor Black Point Check
- Calibrate and Profile your monitor (Mozilla developer Center)
- Color management links exchange (Digital outback Photo)
- Akvis - Calibration Theory
- Bryce Alive patterns
- Timo Autiokari calibration
- Georg N. Nyman - Eye-One Display2 calibration
- Gamma assessment page
- Tim Farrar - calibration tips
- Tim Farrar - calibration article
- OceanLight.com patterns
- UPDIG calibration
- Dry Creek Photo - gray gradient
- Dry Creek Photo - black point
- Monitor Calibration: Who needs it? (Imaging-Resource.com)
- Fogra Softproof Handbook
Links ICC:
Eizo CG19 line of LCD displays.
Display gamma estimation applet from Hans Brettel.
To inspect, compare and evaluate ICC profiles, I use Gamutvision and Imatest.
Both were written and are being periodically updated by Norman Koren. See the corresponding web sites for details (click on the icons)
For color conversions, spectral measurements, and color space transformations , I prefer the BabelColor Color Translator and Analyzer (CT&A) written and frequently updated by Danny Pascale.
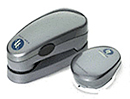
Eye1 Pro spectrophotometer (left) and the Eye1 Display colorimeter (right) .