

ProfileMaker:
ProfileMaker is the industry standard software package for complete color management of a great variety of workflows. It allows building and editing the ICC profiles for displays, printers (RGB, CMYK), cameras, projectors, and scanners. Included modules can generate test charts, compare data collected from color measurement devices, convert spot colors to process colors and more.
Since it is a very capable software suite, it is also highly priced. Fortunately, some of the modules are free and can be used on your computer without paying a penny. One of those modules is the MeasureTool-Measuring part. It allows to measure patches off the screen and to generate standard output files (LOGO) that can be used for further processing.
Since I have no experience with other modules, I will only describe one specific use of the free module - the MeasureTool and its Measuring part for characterization of a monitor calibration. Also, it is important to mention that PM5 supports only some measuring devices (mostly made by the former GretagMacbeth, listed later). Unforunately, it does not support the X-Rite DTP-94 colorimeter.
(top)↑Installation:
- Download the version 5.0.8 of the PM5 and click on the downloaded file.
- Follow the installation messages on the screen.
- I have not seen any problems with the installation.
Run it:
- Connect the EyeOne Pro or any other supported device to the USB connector.
- Launch the PM5 from Start->All programs->ProfileMaker Pro 5.0.8.
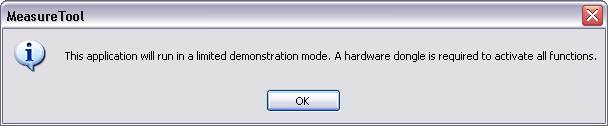
- The following message will appear - just click OK.
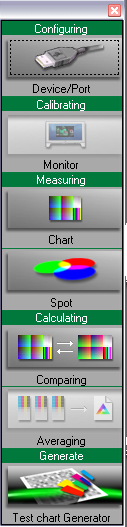
- A new panel will appear on the left.
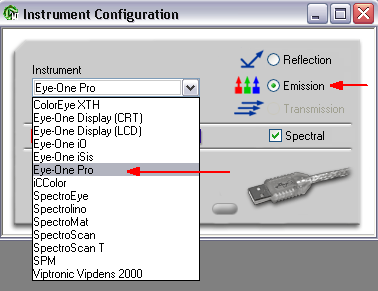
- Click "Configuring" icon at the top and select the proper measuring device. List of supported devices is on the following snapshot. Once the connection is sucessfuly established, you will see an "OK" message in the left lower corner. Leave the port at "AUTO". If using the EyeOne Pro, choose the "Spectral" mode to acquire spectra.
- Close the "Instrument Configuration" window.
- Click the "Measuring" icon and select the "Test Chart". Download the ramp and gray-scale test charts here. The default location of those files is at C:\Program Files\GretagMacbeth\ProfileMaker Professional 5.0.8\Reference Files\Monitor. Alternatively, you can create your own test chart using the following LOGO format:
RGB Ramps
BEGIN_DATA_FORMAT
Sample_ID	RGB_R	RGB_G	RGB_B
END_DATA_FORMAT
BEGIN_DATA
1	255	255	255
2	255	255	255
3	255	255	255
4	255	255	255
5	0	0	0
6	0	0	0
7	0	0	0
8	0	0	0
9	255	0	0
~~~~~~~~~~~~   <<<--- continue with your own data
END_DATA     <<<--- the file has to end with END_DATA
Procesing:
- The saved spectral data has to be transformed to the tristimulus XYZ values. We will use the r2xyz.xls Excel workbook that can be downloaded here. Inspect the data format in sheet "spectra" and continue on in reading the next instructions. Should you wish to work with XYZ data only, uncheck the "Spectral" checkbox in Configuration before running the measurements.
- Open the workbook and from withing the Excel open the spectral text file and import it as "tab-delimited" format.
- In the newly opened spreadheet, copy the whole data field starting at row with 1 A1 255 ....
- Paste the data into the sheet "Spectra" placing the mouese into the cell A2. make sure that all 161 rows of data was pasted succesfuly.
- In the "Process" sheet, click the "1. Clear" macro button to clear the old data.
- Click the "2. r2XYZ" macro button to convert the spectral data into the tristimulus XYZ data.
- Click the "3. Bradford to XYZ D50 => Lab" macrobutton to convert XYZ data recorded at a monitor white point to the D50 illuminant. The corresponding L*a*b* (D50) data is also calculated.
- Use the XYZ data in the first blue field (G10:I164) for further processing in Excel workbooks Ramps_XYZ.xls, Patches_XYZ.xls, and Gray_XYZ.xls. This data would be copy/pasted into the respective workbooks into the sheet "data_in" starting in cell A2.
In this short tutorial, we have learned how to use the PM5 (free module) for measurement of custom lists directly off the screen. The results are the same as when the Argyll CMS is used.
(top)↑Notes:
This section is reserved for comments and tips from other users.
Last update : August 25, 2008