Get gamma of your monitor:
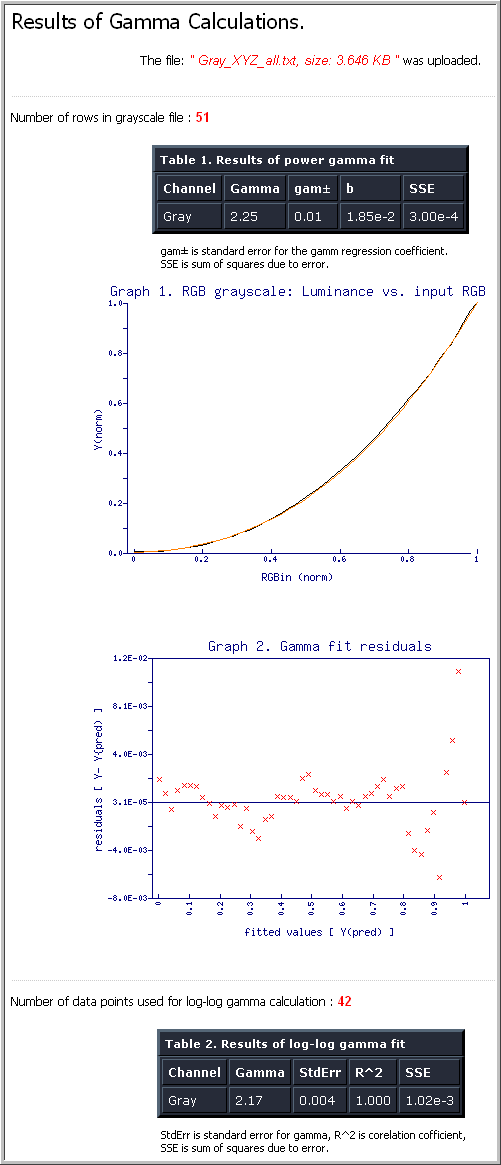
This page was built to allow processing of your own data collected during display characterization as discussed at "Monitor Color management" page. By providing the input R'G'B' and output XYZ values, either grayscale gamma or per channel (RGB) gamma values and the corresponding curve fitting statistics and plot of gamma curves and residuals are returned. In both cases, there is a graphical output provided to assess quality of monitor calibration and gamma fit.
Even if you did not follow display characterization techniques described here, you can still benefit from scripts implemented at this web page. Simply measure gray or RGB patches off your monitor, prepare data file as described below and upload it for gamma calculation. This way, gamma of your monitor or gamma targeted in your calibration software can be verified.
Short description:
- Download Excel "processing" spreadsheets "Ramps_XYZ.xls" or "Gray_XYZ_web.xls", respectively. These spreadsheets were written to process measured display data and output a simple text file for additional processing. Save these files on your computer.
- When measurements are finished and data entered into the spreadsheet (follow instructions in the workbook), go to tab "data_all" and press button "Export RGB ..". Formatted text file will be created in the same directory where the excel spreadsheet is. Name of the filename will be *_all.txt.
- The other way (and more general) to process measurement files is to use the processing scripts at this web site. To extract measurement data from files created by software applications such as ProfileMaker 5, Argyll CMS (ti1, ti3 files), BabelColor PatchTool, use Go to this
 this link and upload files that you obtained after monitor (but also scanner, printer) measurements. Files will be formatted for immediate use in the next gamma processing script.
 - Only the "core" data (RGB, XYZ) will be extracted and can be easily used later with the GamaCalc module. Slight formatting may still be needed as per instruction at the bottom.
- Go to this
 entry page, choose the type of gamma curve, upload *_all.txt file, and click submit.
At this point in time, gamma is calculated by fitting the input/output data to: (A) standard SRGB encoding model (V) described at "Monitor Gamma" page. I have also added (B) "classical" log-gamma calculation based on linear regression in logarithmic domain. This option is only available for grayscale gamma. For a quick assessment of gammas for each RGB ramp or in case that fit to the model (A) fails , "classical" power function (II) is used (C). Naturally, these three gamma values differ as their underlying formulas are different (see notes at the result fit page). Values obtained by mehods B and C are usually very close to each other. Values reported by method (A) are higher although predictive and consistent.
You can test data processing at this web page with the following "test" files (save them and upload them in the entry page):
- Grayscale test file gray_example.txt
- Grayscale ramp (LOGO) Gray_ramp.txt (for PM5, PatchTool)
- RGB ramps - test file ramps_example.txt
Figure 1: Typical results of grayscale ramp fit - details follow output

Long Description:
- Read the "Short description" above first.
- Custom input file can be created and submitted to this script as well. It is important that you save your data as tab delimited text file.
- Go to this
 entry page, choose the type of gamma curve, upload *_all.txt file, and click submit.
| Figure 2: Example of grayscale tab separated file format |
|---|
 |
Format of grayscale and ramp files is very similar. There are no headers in the first line. Each file has six column (R,G,B,X,Y,Z). RGB values go from 0-255, XYZ values from 0-100. There is a tab between each value. Any number of lines is fine. For ramps, there should be three sets of ramp values (R, G, B) - again any step is fine. The easiest way to prepare such a file would be to use any spreadsheet program and save values as tab delimited file.
Grayscale format notes:
If you choose to build your own input file, a few additional steps will be needed. Until I build some intelligence into the parsing script, please add one line at the beginning and six extra lines at the end of your file. Each line should start with an alphanumeric symbol, e.g. x (see Example below). Rest of the line can be left empty. Ascending order (based on the first column) is also important at this point in time.
Example:
x
0	  0	 0	0.2	0.24	0.22
~	  ~	 ~	~	~	~
255	  255  	255	96.4	100	82.5
x
x
x
x
x
x
RGB Ramps - format notes:
| Figure 3: Example of ramp input file - tab separated format |
|---|
 |
No special formatting is required. Just keep the same number of steps for each ramp. For five step RGB ramp, his would be 52 lines per channel Figure 3). No additional lines are needed.


