

BabelColor CT&A:
Color Translator and Analyzer (CT&A) from the BabelColor Company is a great and versatile tool for conversion, analysis, and comparison of colors in about twenty RGB color spaces. These include Adobe (1998), Apple RGB, Bruce RGB, CIE RGB, ColorMatch, ProPhoto, and sRGB. For specific transformations, an RGB space with custom primaries, a custom illuminant, and a custom gamma can be defined. Input data can be either entered from the software GUI or measured directly via a connected colorimeter/spectrometer. Supported instruments include: GretagMacbeth Eye-One Display, Display 2, and Eye-One Pro models. Colors can be compared and differences quantified by several color-difference formulas, such as CIELAB, CIE94, and CIEDE2000. With the Eye-One Pro spectrometer, an ambient illumination analyzer, a full featured densitometer, and a wide variety of other spectral tools can be accessed. CT&A was developed and is being continuously improved by Danny Pascale. Besides the measurement and conversion capabilities, I found the CT&A application to be an excellent educational tool that allows me to experiment with colors and to understand details of the color space transformations. CT&A has all the necessary tools for measurement of display characteristics, printed patches, ambient light, and much more. One unique feature of this software is the dynamic calculation of Bradford matrices, Illuminant data, RGB->XYZ matrices, and the complete description of any given RGB color space including conversion matrices.
Software documentation is excellent with lots of examples and tutorials. The documentation can be downloaded separately at the BabelColor web site. This web page will limit its discussion to only some examples not described in the manual. I definitely recommend taking a closer look at this software product (demo version is available).
PatchTool:
PatchTool has historically been a complementary program to the CT&A, coming also from the BabelColor Company. Now, it is quickly gaining popularity and is becoming an important standalone program for processing the color data from multiple sources. PatchTool allows you to visualize, manipulate, re-order, average, compare (with statistics), convert, and export color data in a color-managed environment. One can export a list as an image, in a plain text format file, or in the standard CGATS file. Recently, the "Display Check" module has been added that allows measurement of the display characteristics using a built-in or custom set of patches. Supported instruments include: GretagMacbeth Eye-One Display, Display 2 , Eye-One Pro models, Spyder2, Spyder3, and DTP-94 colorimeters. The measured values are then presented against the reference values followed by a statistical analysis performed on the differences for any color parameter. Similarly to the CT&A application, PatchTool has lots of tutorials and examples worth of reading.
(top)↑Digital ColorChecker and a calibrated monitor:
In this example we will use the digital version of GretagMacbeth ColorChecker to assess the quality of our current monitor calibration and profile. We will use the Eye One Pro spectrometer. Monitor is again the Eizo CG-19. Since the monitor calibration was done using the DTP-94 colorimeter, values measured by EyeOne Pro instrument in this particular example will lead to larger color differences.
I have learned this method from Danny Pascale at the time when I was trying to figure out discrepancies between the L*a*b* values read off the monitor and the reference data.
Just a note - there is a similar method described at the HCFR section of these web pages. It uses the HCFR Colorimeter and Adobe Photoshop. Also, this procedure is automated when using PatchTool "Display Check" module which is color-managed.
First, the ColorChecker: the most comprehensive description of available ColorCheckers is at Danny Pascale's web site. For these measurements we will use the L*a*b* version (free from the BabelColor web site). This version has encoded L*a*b* D50, 2 degree observer values made available by GretagMacbeth in 2005. The corresponding reference data is available from the same web site as a part of the following document: "RGB coordinates of the Macbeth ColorChecker" (p.5 at the top).
Let's outline the steps that we will go through:
- In Photoshop (or in any color managed application), open the downloaded file "ColorChecker_Lab_from_GretagMacbeth.tif". This particular file has the Lab D50 data embedded in it. Convert it to the display profile (Edit -> Convert to Profile) with the absolute colorimetric rendering intent. This creates the same profile for the source and destination (display) resulting in no transform. Gamut primaries correspond to the monitor primaries determined during the calibration/profiling steps.
- Attach your measuring device (EyeOne Pro) to the computer (typically via any USB input).
- Open the CT&A application. Go to Peripherals -> Measurement mode -> Emission.
- From the same menu, click "Calibrate". The software will ask for internal instrument calibration and then for measurement of the display white.
- Create a white patch using, for example, a text editor such as Notepad somewhere in the middle of the display area. Any other source of the white will suffice (background of the Windows explorer). This works because even in a non-color managed application, the display LUT is still active and the White Point (in fact all the gray scale) will be the same as in color-managed application. Position the measuring device on the white patch and press Ctrl+L to take a measurement in Space#1. Read the monitor color temperature right under the YRGB sliders in the Space#1 (6600 K). Current monitor luminance will be displayed as well.
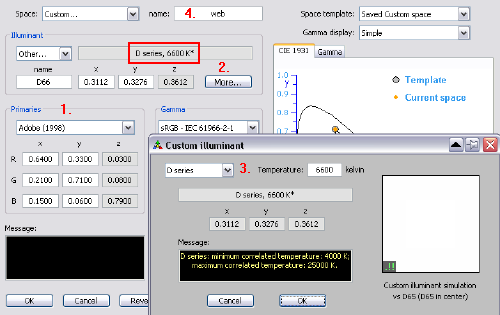
- In the main menu, define a Custom RGB color space by going to Tools -> Define custom RGB ... and choose Adobe RGB in "Primaries" (1). In the section "Illuminant", choose "More" (2) and enter the measured Temperature (above) with the D-series selected (3). Click OK. Now, in the field "Name" write an intuitive name for your custom space (e.g. RGB6600, 4). Click OK.
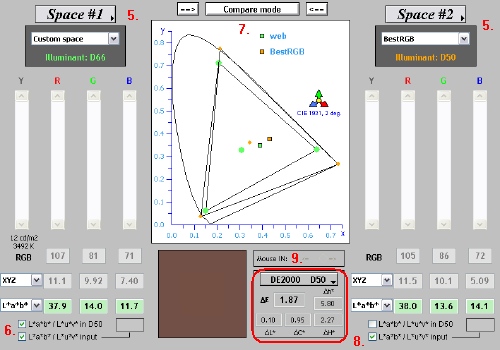
- Now still in the Main view - choose the Custom space in Space#1 and the Best RGB in Space#2 (5). At this point we have the Space #1 defined by our display white point and described by a gamut that is larger than any of the ColorChecker patches. Space #2 is defined by the D50 white point which is the reference for the original Lab D50 Color Checker image. In the Space #1, check the L*a*b*/L*u*v* input and also select the L*a*b*/L*u*v* in D50 (6). By doing that, the following measurements will assume the instrument input with the D50 illuminant. At the same time, a relative colorimetric conversion from D50 to D6600 will be performed. Thus, the resulting L*a*b* and XYZ will be converted to D6600 illuminant.
- Move the main window away from the image in Photoshop, position the measuring device on the first patch (brown) and press Ctr+L. A measurement will be taken that will output adapted D6600 data to the left panel. By clicking the Convert/Compare Mode at the top of the window (7), the data will be converted to the D50 illuminant (defined by the Best RGB color space). Conversion is done with relative colorimetric intent. Write the L*a*b* values in the Space #2 down and continue with other patches. You can also copy the values by placing the mouse over one of the L*a*b* values and, after a right-click, select the "Copy Space #2 data: L*a*b*" menu; the copied values can be pasted in a spreadsheet or word processor.
- Alternatively, leave the Compare mode on and enter the reference L*a*b* values for the D50 illuminant into the L*a*b* fields in the Space#2 (in green; 8). We have downloaded the reference data earlier as discussed at the beginning of this exercise. Then select the DE2000 D50 color difference tab - pull down menu next to the brown patch. Color difference ΔE with other color difference characteristics will appear below the pull down menu (9).
- Continuing directly from point 8, enter the L*a*b* values for all measured patches into a simple text file and save as CC_D65_D50_measured.txt. If you pasted the measurements in a spreadsheet, you can save the spreadsheet as a Tab-delimited (.txt) or Comma-Separated-value (.csv) file.
- In the PatchTool application, open the file "GretagCC_G50.txt" (standard ColorChecker 2005 D50 values). In the option menu, choose D50 and 2 degree observer. This file can be opened in the free PatchTool demo mode.
- In the lower left part of the opened window, choose "Row QTY:" and type 6. Continue by selecting "Turn 90o CW" (on Re-map tab) followed by the "Flip Horizontal". Now, you should see the ColorChecker in its standard orientation. Do the same for your file "CC_D65_D50_measured.txt".
- Next, choose Tools -> Compare and check the correct boxes for reference and sample. Click OK and ColorChecker should appear with the yellow or red rectangles highlighting the patches with larger color differences. Make sure that DE2000 is chosen as the color difference formula. The Compare tool requires the purchased version of PatchTool but you can still compare the patches one by one in the demo version.
(top)↑Checking the display white point:
The monitor white point is a critical parameter of the monitor calibration process. It is the described either by a temperature in Kelvins or as CIE D-series source. To confirm the expected value of the display white point (in this case D65 = 6504 K), a measurement of the current display temperature will be performed and obtained values will be compared with the standard white point of the sRGB color space (D65). In this example the monitor was calibrated to D65 white point. While the actual color temperature may drift in time, the differences during the measurement session can vary even ±50 K.
DO NOT FORGET TO WARM UP YOUR DISPLAY for about 30-60 min. prior taking measurements.
Should you wish to compare your monitor white point to some other standard D-series source, use the Custom space as described in point 6 of the previous example.
- Open the CT&A application. Go to Peripherals -> Measurement mode -> Emission.
- From the same menu, click "Calibrate". The software will ask for internal instrument calibration and then for measurement of the display white.
- Choose the sRGB color space in Space#1 and check the box L*a*b /L*u*v* input at the bottom of the main window.
- Create a white patch using, for example, a text editor such as Notepad somewhere in the middle of the display area. Any other source of the white will suffice (background of Windows explorer). File Position the measuring device on the white patch and press Ctrl+L to take a measurement in Space#1.
- Choose the sRGB color space in Space#2 and check the box L*a*b /L*u*v* input at the bottom of the main window. Enter the luminance (L*) from Space#1 into the L* field of the L*a*b* input in Space#2. These are only relative numbers and thus they do not play any role in color difference calculations. Enter 0 into a* and b* fields of the L*a*b* input (perfect white in "ideal" color space has L*a*b* = 100, 0, 0). Space#2 represents our standard against which we compare our measured values. Press "GO" to enter the data.
- Select the DE2000 color difference tab - pull down menu next to the brown patch. Color difference ΔE with other color difference characteristics will appear below the pull down menu.
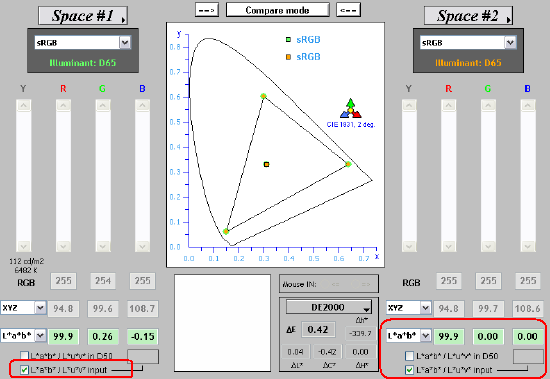
Inspection of the data shows that DE2000 for the current white point is 0.42 (referenced to ideal D65). This color difference is caused solely by shift in chroma (ΔC = 0.42). Color temperature of the monitor is 6,482 K (Space#1, below YRGB sliders). Positive value of a* component suggests a slight shift towards the magenta, while the negative shift of b* component suggests a shift towards the blue region. These changes are negligible,not visible, and within the error of monitor fluctuation.
Display Profile Validation:
see the corresponding section in the Imatest part of these web pages.
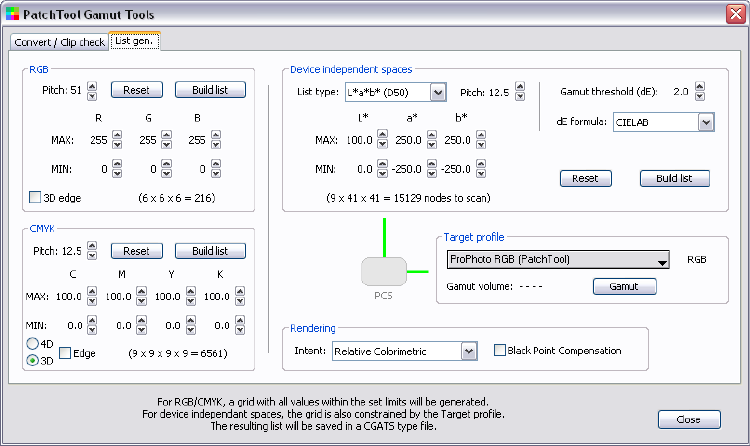
PatchTool - Gamut Tools:
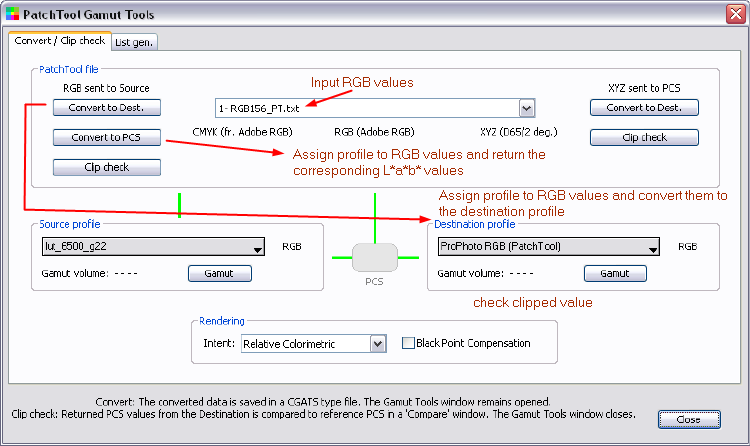
is a new module (included in version 2.5 and higher) that allows conversion of color lists using one or two ICC profiles, checking if a color list will be clipped by a profile conversion, and generation of fixed pitch color lists in device dependent (RGB and CMYK) and device independent (L*a*b*, L*C*h*, XYZ) color spaces. You can also get the patches located on a profile edge or obtain the gamut volume of a profile.
See a practical example of RGB->LAB conversion using an icc/icm profile in the Display Characterization part of these web pages.
PatchTool - DisplayCheck:
Evaluation is ongoing.
Extract Measurement Data from Output Files:
For simple extraction of measurement data from any LOGO or CGATS formatted file, use scripts at this web page. Such files are typically created by ProfileMaker 5, Argyll CMS, and BabelColor PatchTool applications.
(top)↑Notes:
This section is reserved for comments and tips from other users.
Color Translator and Analyzer - BabelColor
Patch Tool - BabelColor