

Imatest:
Imatest is a capable software package for measuring the key image quality factors. Based on analysis of those images, characteristics of cameras, lenses, printers, and scanners can be assessed in a great detail. Imatest consists of several modules that specifically analyze images of standard targets such as GretagMacbeth ColorChecker, Kodak Q-14, IT8, and many more. Imatest runs in compiled Matlab under Windows (2000 - Vista) and on Mac systems under Virtual PC. It was developed and is being further improved by Norman Koren. There are two versions for photographers - Studio and Master. Imatest Studio has everything that serious photographer needs for testing cameras, lenses, display calibration, printers, print papers, icc profiles and other technical parameters of digital imaging devices. There is a plenty of options for gamut visualization, icc profile inspection, color space conversions, and data comparison. Imatest has its own forum where development, bugs, and usage of Imatest are discussed.
There is very detailed documentation on the Imatest web site with a multitude of examples included. This web page will only focuses on examples not described in the manual. These would be examples that I found useful for analysis of LCD displays, printers, scanners and icc profiles. I definitely recommend reading and printing the Manual as it contains lots of theory and interesting observations.
Gamutvision:
Gamutvision is yet another product of the Imatest LLC. It is a gamut viewer based on the same architecture as its big brother Imatest. It is a powerful tool for learning color management, exploring icc profiles, and proofing color workflows. One can view gamuts of color spaces, displays, scanners, and printer profiles with immediate simulation of gamut mapping and rendering intents. Gamutvision enables preview of printer, paper, and display performance using icc profiles provided either by a manufacturer or profiles generated by yourself. While there is some overlap in modules between Gamutvision and Imatest, the latter does not allow gamut preview and gamut mapping simulation. Gamutvision has also its own forum where development, bugs, and usage are discussed. Similarly to the Imatest, Gamutvision has lots of tutorials and examples worth of reading (go to the bottom of this link).
(top)↑Display Calibration/Profile Validation:
In this example we will assess the quality of display calibration and the corresponding display profile which was created in other example at this site. While using the digital version of the GretagMatbeth ColorChecker, we will compare results obtained from the experimentally measured ColorChecker patches (Imatest-Multicharts) with the "theoretical" ColorChecker data.
Here is what we will need:
- Digital ColorChecker in L*a*b* (TIF) file format (free, downloadable)
- PatchTool from the same BabelColor web site ($)
- Photoshop or any other color managed application
- XYZ tristimulus or L*a*b* data of ColorChecker patches measured from the calibrated & profiled display
- Excel or similar spreadsheet program
To begin this example, let's start with a flowchart that shows all the steps that we will go through:
| Figure 1: Profile validation using digital ColorChecker |
|---|
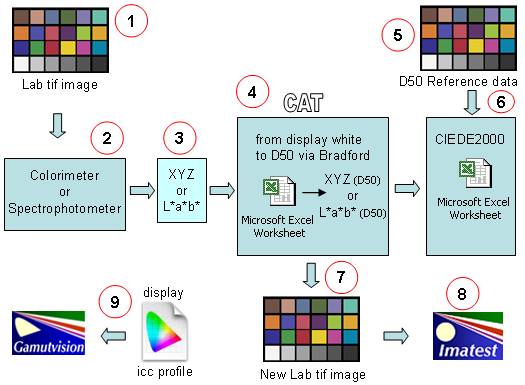 |
First we need to download the digital version of the ColorChecker. There are several types around usually in a form of a tiff file. They differ by L*a*b* or RGB values depending on what version or what source is considered the reference ColorChecker. The most comprehensive description of a wide variety of ColorCheckers is at Danny Pascale's web site. For my measurements I am using the "universal" L*a*b* version (free from the BabelColor web site). This particular version has L*a*b* D50, 2 degree standard observer values encoded and was made available by GretagMacbeth in 2005. The corresponding reference data is available from the same web site as part of the following document: "RGB coordinates of the Macbeth ColorChecker" (p.5 at the top). After a quick download, we should have both the digital image (1) and the reference data (5) available.
In the next step, we want to measure the tristimulus (XYZ) or L*a*b* values of all ColorChecker patches straight off the screen. This step will be described in details at some other place.
(top)↑
A:
The following step (4) involves a little bit of processing. Since chances are rather high that our monitor CCT (or the white point) will not correspond to any defined CIE source (such as D50 or D65), chromatic adaptation transform (CAT) has to be performed on the obtained XYZ tristimulus data. Provided Excel sheet has the Dxx->D50 Bradford transform implemented. It changes dynamically depending on the measured XYZ coordinates of the display white. ColorChecher reference data (5) is already entered there (GretagMacbeth D50, 2 degree standard observer, 2005), so we only need to provide the XYZ data from the measurement. The last step at this point is to calculate the CIEDE2000 color difference values (just click on the corresponding macro button in the sheet). Average and maximum DE2000 is returned. Next tab in the workbook summarizes data for further analysis (optional). Tab called "logo_lab" converts the D50 L*a*b* values into the standard LOGO format that can be directly opened in PatchTool or ColorThink Pro software. Just press the macro button and the corresponding *_lab.txt file will be created in the same directory where your Excel workbook resides (download here). For more details on the use of this worksheet, read the step-by-step instructions in the HCFR section.
B:
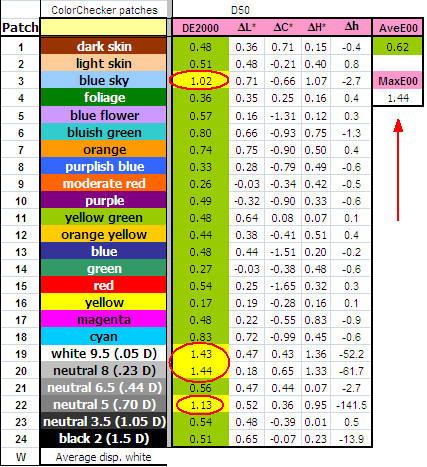
At this point (6), we have a pretty good idea about the quality of our display calibration/profile. Data provided in the Excel sheet came from the measurement of the Eizo CG19 monitor using X-rite DTP94 colorimeter. Measurements were done using the LUT based profile - large933.icm. Average DE2000 is 0.62 with maximum color difference of 1.44 (Figure 2). These are very good numbers, in average below a noticeable difference. Inspection of the data reveals that larger values of color differences come from the white and gray patches (No. 19, 20). This would indicate potential inaccuracies in grayscale images.
| Figure 2: Results of CC characterization |
|---|
 |
(top)↑
C:
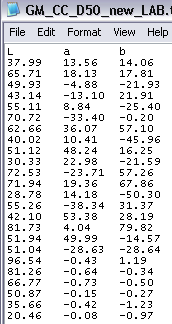
Let's continue in the exercise and export the D50 L*a*b* values from the "logo_lab" tab. Our next task will be to generate a new tiff image - new digital version of the ColorChecker measured off our display. While there may be other small utilities for converting text values into the image file, I prefer using the PatchTool (fast and easy).
| Figure 3: PT input file |
|---|
 |
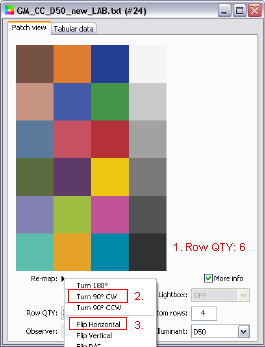
| Figure 4: PatchTool import |
|---|
 |
| Figure 5: PatchTool export to tiff |
|---|
 |
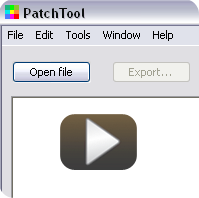
- Launch the PatchTool (PT), choose "Open File" and select the LOGO formatted file created in the previous paragraph. Alternatively, you can also open a simple text file with D50 L*a*b* or XYZ data formatted as shown in Fig. 3 (the first row has to have coordinates identifier - L a b, R G B, X Y X, ...).
- When opening the file, message window "Missing info" will appear. Choose "Illuminant D50" and "Observer 2 degree". Click "Proceed".
- Window similar to Fig. 4 will appear. In the lower left part, choose "Row QTY:" and choose 6. Now what you see should match the Fig. 4. Continue by selecting "Turn 90o CW" (2.) (on the Re-map tab) followed by "Flip Horizontal" (3.) . You should now see the ColorChecker in its standard orientation.
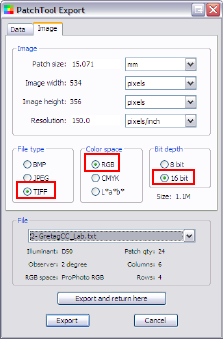
- Click on the "Tabular data" tab, choose ProPhoto in the "RGB space" and then "Export". Choose "Image" and adjust numbers according to Fig. 5 (use 16-bit encoding).
- Click "Export" and the tiff file of your "screen" ColorChecker will be generated. Close the PatchTool.
- Note: The tiff image contains embedded ProPhoto RGB data that must be re-calculated for other RGB color spaces. To ensure consistency with the D50 Lab values, we use the ProPhoto RGB color space since it is defined for the D50 illuminant. Lab values calculated from the embeded RGB values will be the same as the ones in the input file.
For Flash movie of the described steps, click the image.
D:
Now, let's analyze the data in the PatchTool. We will repeat the same steps as in the preceding paragraph (C: 1-3) and we will open the standard ColorChecker (D50, 2o observer, Fig. 3) together with the formatted *_lab.txt file of the just measured ColorChecker (for a reference, download it here). At this point it is worth mentioning that PatchTool can provide a complementary analysis to the Excel spreadsheet shown in section B: when "Compare" option is selected from the Tools menu. The Excel workbook mentioned above has also an option to export reference LOGO formatted D50 L*a*b* values of the ColorChecker. When you open both files in the PatchTool, "Compare" option will become active and your "display" ColorChecker can be compared with the standard reference ColorChecker. Additional statistics is returned in the corresponding tab.The next steps are following:
- Make sure that both files are opened in the PatchTool - the standard ColorChecker D50 and your new file *_lab.txt..
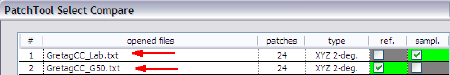
- In the PatchTool (PT) main menu, choose "Tools" and then "Compare". Window similar to Figure 6 will appear. Just check the reference and sample files and make sure that D50 illuminant is selected. Click "Compare".
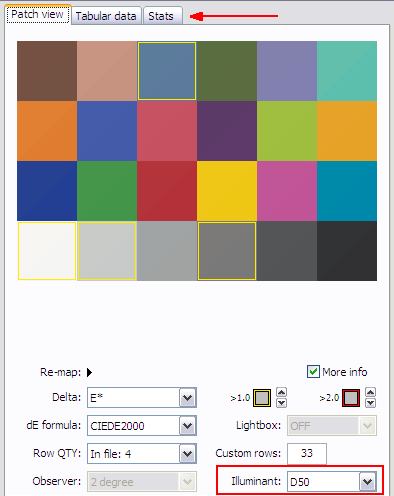
- Window similar to Fig. 7 will appear. Choose E* in the "Delta" and CIEDE2000 in the "dE formula" as shown in the Figure 7. Also, change/set the color difference thresholds in the yellow and red rectangles. In this example, patches with DE00 > 1 are in yellow frame and patches in the red frame have DE00 > 2 (none). Make sure that D50 illuminant is selected.
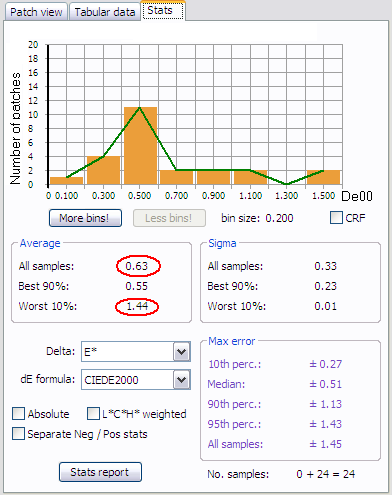
- Click on the "Stats" tab to inspect the analysis results (Fig. 8). As in the Excel sheet, average DE00 value is 0.63 and the maximum value is 1.44. Standard deviation within the samples is 0.33 (sigma). The graph shows that 11 samples have their DE00 > 0.4 and < 0.6. Only two patches have DE00 greater than 1.4, but lower than 1.6.
- By clicking on the patches in the "Patch view" we learn that two worst patches are the whites (19,20). Closer inspection of the L*a*b* data reveals that the "White 9.5" patch (19) has a shift in the a* component although a negligible one. The patch 20 (Neutral 8) shows a shift in the b* component of a greater magnitude (1.46) - toward the yellowish hue. The same is true for the patch 22 (Neutral 5). Interestingly, the cyan patch (18) that is outside the sRGB gamut is still quite a good in the monitor. The main cause of its color difference (DE00 = 1.31) is the higher luminance (0.72). Overall, the monitor renders the ColorChecker quite well and we would see no troubles when editing digital images.
| Figure 6: PatchTool "Compare" module |
|---|
 |
| Figure 7: PT Compare two ColorCheckers |
|---|
 |
| Figure 8: PatchTool import |
|---|
 |
E:
To manipulate/evaluate the tiff file in Photoshop, follow this procedure - valid for embedded D50 values:
- This part assumes that you have a digital ColorChecker with the embedded D50 Lab data. This would be accomplished by choosing the "Lab colorspace" in the Export tab of the PatchTool (section C:, Figure 5).
- In Photoshop, choose the "File-Open"and select the tiff file created in the previous section. It has embedded D50 Lab values and it should display correctly through the monitor profile.
- Choose 'Convert to Profile" option and select the ProPhoto RGB color space. In the "Intent", choose the "Relative Colorimetric" (Black point Compensation is irrelevant in this case since we deal with "ideal" profiles).
- After the conversion you can inspect the RGB and Lab values and compare them with published ones.
- Click "File->Save as ", choose the tiff file with no compression. Do not embed the profile to the file. Digital ColorChecker ready for the use in the Imatest (next paragraph) will be generated. Close the Photoshop.
(top)↑
F:
And now - finally, we are getting into Multicharts module of the Imatest.
- Launch the Imatest (Studio) and choose the Multicharts module.
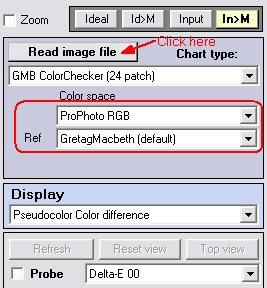
- Choose the options shown in Fig. 9 and click the "Read image file" button.
- Select the tiff file created in the section [C] and create the ROI area by dragging the mouse from the top-left to the bottom-right corners. Adjust the ROI area if necessary. Click "Yes" or "Yes continue" depending on whether you adjusted ROI or just used the previous settings.
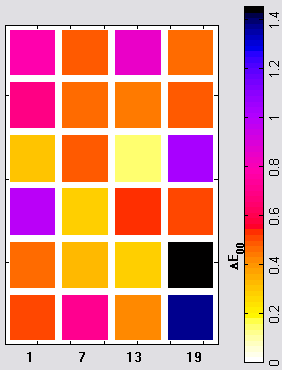
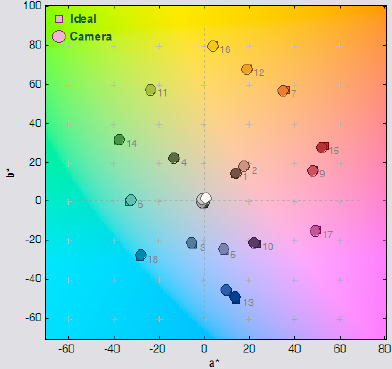
- Explore different views and analyses of the ColorChecker. Fig. 10 shows the pseudocolor difference view for this particular example. We can confirm that patches 19 and 20 show higher color difference from the "ideal" values. Another useful view is the 2D a*b* which reveals some weaknesses in color patches (Fig. 11), particularly in red and blue area. Overall, the ΔE00 is quite low (0.61) indicating very good performance of the monitor together with the corresponding calibration and profile.
| Figure 9: Import into Multicharts |
|---|
|
| Figure 10: Pseudocolor difference in ΔE94 |
|---|
 |
As discussed below in the "Note on Imatest Color Space Selection", it is convenient to process your ColorChecker images in the ProPhoto color space. In brief, the reason is that, first, the Multicharts have the "standard" Gretag Macbeth ColorChecker 2005 D50 L*a*b* data hardcoded in it and second, the L*a*b* (XYZ) values in these exercises are transformed to D50 to comply with the ICC standards. For details, please read the Note below.
| Figure 11: 2D a*b* representation of the "ideal" and "measured" CCs |
|---|
 |
(top)↑
Example of transformation of XYZ (Lab) values to R'G'B' triplet is shown in other part of these web pages.
(top)↑Imatest - Colorcheck :
Colorcheck is another module in the Imatest. As stated in the manual, Colorcheck analyzes images of the GretagMacbeth ColorChecker for color accuracy, tonal response, and noise. These images typically come from a digital camera. While analysis using Multicharts is more universal, the Colorcheck module has some unique features related to cameras not found anywhere else. In order to use the Colorcheck module, one needs to add a black frame to the ColorChecker (Imatest requires that). The following procedure outlines the process of preparing the digital ColorChecker for the use in the Imatest.
- Make sure that the RGB data in your tiff image have been assigned to a standard color space (sRGB, AdobeRGB, WideGamut, ProPhoto RGB, ...). This is important for the correct interpretation of all colors within the image. Usually, when processing raw data, software asks for a color space to use.
- Launch Photoshop and open the image of the ColorChecker acquired by digital camera.
- Open file "GMCC_grid_to_Imatest_ProPhoto.psd" (download here). On the profile mismatch warning, choose "Use the embedded profile". Convert this "frame" file into the color space that you ColorChecker has been assigned.
- With both files opened in the workspace, select the CC-image file and click on its thumbnail in the Layer window.
- Hold "Shift" key and drag the thumbnail onto the main frame psd file. Release the "Shift" key. ColorChecker image should be now part of the frame file, converted into ProPhoto space.
- Move the newly created Layer1 under the layer "Frame". At this point, you should see your ColorChecker with black borders.
- From the Layers palette choose "Flatten image" and save the file as tiff (with or without profile tag). Use "no compression" option when saving the file.
- You should now have the the digital version of ColorChecker properly framed and in a standard color space.
This concludes the exercise of the Display calibration/profile validation. We have used several tools to assess quality of the monitor calibration and profiling.
For simple extraction of measurement data from any LOGO or CGATS formatted file, use scripts at this web page. Such files are typically created by ProfileMaker 5, Argyll CMS, and BabelColor PatchTool applications.
Analysis using the Gamutvision:
Gamutvision can analyze an internal (simulated) GretagMacbeth ColorChecker that is derived from the spectral L*a*b* D65 data supplied by GretagMacbeth (set two as discussed in the box above). Analysis can be performed in different color spaces using different rendering intents.
Gamutvision can also analyze and compare different display and printer icc profiles. This way, it is well suited for a comparison of different calibration/profiling packages, measuring hardware devices, and monitors (gamut size, gamut characteristics). In the case of monitors, the calibration state should be kept constant to ensure that only the profile is evaluated. This is usually not that easy since most of the commercial calibration/profiling packages run calibration first. The only package that I am aware of that can generate a series of profiles while keeping the calibration unchanged is the Argyll CMS.
However, one can still successfully use the Gamutvision for assessment of the display profile volume and for general comparison with other standard color spaces (e.g., sRGB, AdobeRGB). Very informative is the "black point compensation" (BPC) feature that allows you to explore different combinations of the BPC and rendering intents.
Analysis of a measured ColorChecker (or any other digital image obtained from the display measurement) should be avoided as the Gamutvision processes only the icc profile and it is not considering the calibration data stored in your video card LUT (or in the vcgt tag of the icc profile). Again, a qualitative and relative comparison of the display profiles can be attempted providing that those profiles are built on the same calibration.
(top)↑Evaluating the display icc profiles :
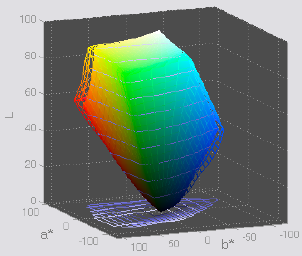
This section describes the process of comparing two icc/icm display profiles created in the Argyll section. Specifically, we will compare gamuts of the LUT based profile "large933.icm", the shaper-matrix profile "small200.icm", and the standard color space as described by the "sRGB.icc" profile. To download both profiles, click here - large933 (774 kB) and here small200 (4 kB). The sRGB.icc is usually part of the computer system or it is coming with any imaging program.
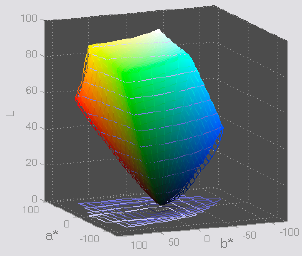
On the left side (Fig. 12), the "large" meshed LUT gamut wraps around the sRGB gamut. First, one can make an obvious observation that the "large" gamut is larger than the sRGB one. The corresponding ratio of the gamut volumes is 1.15. We can see that the "large" gamut has a clear edge in the reds and slightly in the blues. On the right side (Fig. 13), the "large" LUT gamut is plotted together with the "small" one. The corresponding ratio of the gamut volumes is 1.10. It is clear that the "small" gamut is still larger that the sRGB gamut while slightly smaller than the "large" gamut.
| Figure 12: 3D L*a*b* Gamuts large vs. sRGB |
|---|
 |
| Figure 13: 3D L*a*b* Gamuts large vs. small |
|---|
 |
(top)↑Scanner - ICC profile Evaluation:
Coming soon.

(top)↑Printer Profiling:
(top)↑Links and References:
Imatest :
ColorChecker Data :
- BabelColor RGB coordinates, lab data, images (digital version) by Danny Pascale
- ColorChecker RGB Summaries by Bruce Lindbloom (Lab data available as a tiff image)
- GM ColorChecker data Charles Poynton - xyY values
General:
- Earl F. Glynn , efg's general color information
(top)↑Notes:
This section is reserved for comments and tips from other users.
Last update : August 16, 2008
To inspect, compare and evaluate ICC profiles, I use Gamutvision and Imatest.
Both were written and are being periodically updated by Norman Koren. See the corresponding web sites for details (click on the icons)